
By hitmind.ai | Published 2026-10-10 | Updated 2026-10-10
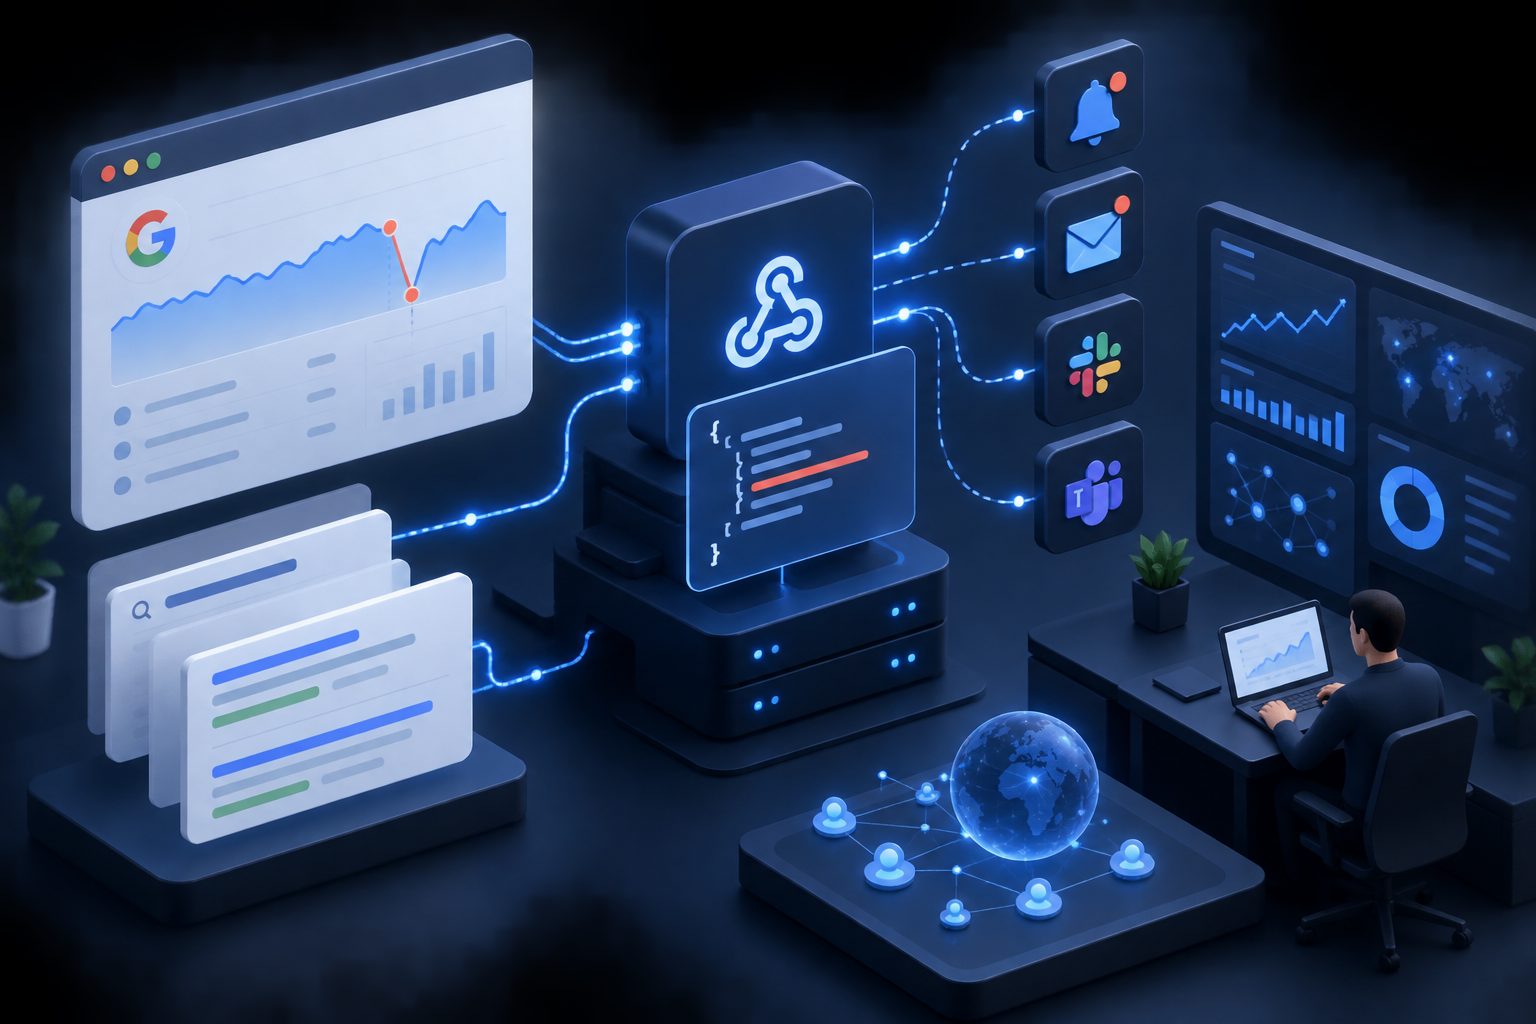
Google Search Console API webhooks alerts are not a native “subscribe once and receive every change” feature. A dependable system combines scheduled API queries, anomaly detection, and an outbound webhook to Slack, Teams, PagerDuty, or your own incident service. The key is to account for Search Console’s reporting delay and incomplete recent data.

What are Google Search Console API webhooks alerts?
Google Search Console API webhooks alerts are an application-level monitoring pattern: your server periodically reads Search Console data, evaluates alert rules, and sends an HTTP request when a meaningful change is detected.
The official Search Console API provides programmatic access to Search Analytics, sitemaps, verified properties, and URL Inspection. It does not provide a general-purpose webhook subscription for every traffic or indexing event. (developers.google.com)
That distinction matters. A webhook is the delivery mechanism, not the data source:
- Scheduler starts a monitoring job.
- Search Console API returns traffic or inspection data.
- Detection logic compares the data with a baseline.
- Webhook sender delivers a structured alert.
- Incident workflow assigns, investigates, and resolves the issue.
This approach is more reliable than sending an alert for every daily fluctuation because it separates data collection from notification.
Does the Search Console API support real-time webhooks?
No. Search Console performance data should not be treated as real-time telemetry. Google states that data is typically available after two to three days, while recent-data modes can include values that are still being collected and processed. (developers.google.com)
A useful monitoring design therefore uses three clocks:
| Clock | Data source | Best use |
|---|---|---|
| Immediate | Website logs, uptime checks, deploy events | Detect outages, 5xx errors, robots.txt changes, and releases |
| Near-term | URL Inspection API and sitemap state | Validate selected URLs after important changes |
| Lagged | Search Analytics API | Confirm traffic, impressions, CTR, and query changes |
This three-clock model is an important safeguard: do not page an engineer because yesterday’s Search Console data is missing or partial. Instead, use immediate signals for operational failures and Search Console data for confirmed search-performance changes.
For a practical API implementation, Google’s Search Analytics query documentation explains the available dimensions, filters, row limits, and recent-data states.
Which events should trigger an alert?
The best alerts are tied to a decision. “Clicks changed” is a weak alert; “non-branded clicks to signup pages fell 35% for two finalized days” is actionable.
1. Site-wide traffic anomalies
Query Search Analytics by date and property, then compare the latest finalized day with a baseline such as:
- The median of the previous 14 comparable days
- The same weekday over the previous four weeks
- A seven-day rolling average
Track clicks and impressions separately:
- Clicks down, impressions stable: investigate titles, snippets, SERP features, or CTR changes.
- Clicks and impressions down: investigate ranking visibility, indexing, demand, technical failures, or search-type changes.
- Average position down with stable impressions: inspect query mix before concluding that rankings collapsed.
Google’s traffic-drop guidance recommends segmenting by search type and checking affected pages rather than relying only on site-wide totals. (developers.google.com)
2. Page-level losses
Page-level alerts are more valuable for SaaS teams than a single domain-wide notification. Group data by page and identify:
- High-converting landing pages losing clicks
- Recently published articles receiving no impressions
- Product pages with a sharp CTR decline
- A cluster of URLs affected after a redesign
The Search Analytics API can group data by page, query, country, device, and other dimensions. However, highly granular page-and-query requests may omit some rows, so treat the API as a ranked reporting source rather than a perfect event log. (developers.google.com)
3. Indexing and deployment anomalies
The URL Inspection API is useful for targeted checks, not for inspecting every URL on every run. After a release, inspect a controlled sample:
- Homepage
- Sitemap-listed page
- Recently changed page
- High-value conversion page
- One URL from each affected template
Alert when the inspection result conflicts with the expected state, such as a page becoming non-indexable after a deployment. Google documents URL Inspection as part of the Search Console API, alongside Search Analytics and sitemap operations. (developers.google.com)
For broader coverage, pair inspection checks with server logs, XML sitemap diffs, canonical-tag tests, and automated robots.txt validation. Search Console itself does not provide a complete crawl history filtered by URL, so log data can fill an important gap. (developers.google.com)
How to build the monitoring workflow
A robust implementation can be organized into five layers.
Layer 1: Authenticate securely
Use OAuth 2.0 and request the narrowest practical Search Console scope. The API requires appropriate access to the property, and Google recommends understanding the Search Console interface before coding against its reports. (developers.google.com)
For production systems:
- Store refresh tokens in a secrets manager.
- Encrypt credentials at rest.
- Separate development and production Google Cloud projects.
- Log property identifiers, not access tokens.
- Rotate credentials when ownership or agency access changes.
Layer 2: Collect finalized data
Run a daily Search Analytics query for a completed date. Google recommends daily collection because it reduces repeated queries and helps avoid quota pressure. The API exposes up to 50,000 rows per day per search type, while each response supports a maximum rowLimit of 25,000. (developers.google.com)
A simple collection record might include:
{
  "property": "sc-domain:example.com",
  "data_date": "2026-10-07",
  "search_type": "web",
  "dimensions": ["page"],
  "clicks": 842,
  "impressions": 21450,
  "ctr": 0.0393,
  "position": 11.8
}
Store raw responses before aggregation. Raw data makes it possible to reproduce an alert and refine thresholds later.
Layer 3: Detect meaningful changes
Use relative and absolute thresholds together. For example:
Trigger when:
- clicks are down at least 30%;
- the baseline contains at least 200 clicks;
- the change persists for two finalized days;
- and impressions are also down at least 20%.
This prevents low-volume pages from generating noisy alerts. For small SaaS sites, absolute minimums are often more useful than percentage-only rules.
A practical severity model:
- Info: 15% movement for one day
- Warning: 30% movement for two finalized days
- Critical: 50% movement plus a technical or indexing signal
These thresholds are operating recommendations, not Google-defined standards. Calibrate them against 30–60 days of your own data.
Layer 4: Deliver the webhook
Send a compact payload containing context, evidence, and a next action:
{
  "event": "gsc_traffic_anomaly",
  "severity": "warning",
  "property": "sc-domain:example.com",
  "data_date": "2026-10-07",
  "segment": "non-branded / signup pages",
  "change": {
    "clicks": "-34%",
    "impressions": "-27%"
  },
  "recommended_action": "Check recent deployments, canonical tags, and URL Inspection samples."
}
Make webhook delivery idempotent. Include an event ID, retry failed requests with backoff, sign the request with a secret, and record delivery status. The receiving system should acknowledge quickly and process the event asynchronously.
Layer 5: Create an investigation link
An alert without a diagnostic path becomes notification noise. Include:
- The affected property
- Date range and comparison period
- Top losing pages
- Top losing queries, where available
- Search type, country, and device filters
- Relevant deploy or sitemap events
- A link to the internal incident or dashboard
For teams building a larger reporting pipeline, the Google Search Console BigQuery sync workflow provides a useful model for retaining queryable historical data.
What are the main API limits and failure modes?
Google Search Console API automation commonly fails for four reasons:
- Treating delayed data as real-time. Recent values may be incomplete.
- Querying too much detail too often. Page-and-query combinations are more expensive and may lose data.
- Ignoring quota controls. URL Inspection has per-site limits, including 2,000 inspections per day and 600 per minute under the documented quota. (developers.google.com)
- Alerting on one noisy observation. A single day can reflect seasonality, reporting lag, or normal variance.
Use exponential backoff for quota errors, cache unchanged results, and prioritize high-value URLs. The Search Console API rate-limit monitoring guide covers a complementary approach to tracking API consumption.
Frequently asked questions
Can Search Console send traffic alerts directly to a webhook?
Not through a general Search Analytics webhook subscription. You normally need a scheduled collector, detection logic, and your own webhook delivery layer.
Can Search Console API alerts be real time?
Not for finalized organic-search performance. Search Console data is delayed and recent data can be incomplete. Use logs, uptime monitoring, and deployment events for immediate detection.
Should every URL be checked with URL Inspection?
No. Use URL Inspection selectively because it has quotas. Combine sampled inspections with sitemap checks, crawl logs, canonical validation, and deployment testing.
What is the best alert threshold?
Start with a percentage threshold plus a minimum traffic floor and persistence requirement. For example, a 30% decline across two finalized days is usually more useful than a 5% one-day fluctuation.
How can SaaS teams make alerts actionable?
Segment alerts by business value: signup pages, product pages, branded queries, non-branded queries, and content clusters. Include the affected URLs, comparison window, evidence, and a specific investigation step.
Final takeaway
Google Search Console API webhooks alerts work best as a scheduled, evidence-based monitoring system, not as a pretend real-time feed. Use immediate operational signals for outages, lagged Search Console data for validated search changes, and targeted URL Inspection checks for indexing risk.
That architecture gives growth teams fewer false alarms and a clearer path from anomaly to diagnosis. For teams building an SEO automation stack, HitMind focuses on audit, content workflows, and Search Console-based verification; the public free SEO audit is available without registration or payment.